Hi to all
I would know if it is possibile to draw/plot a graph of a function y=f(x) where x is not time.
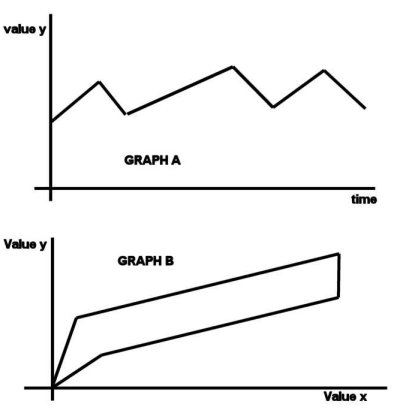
I looked for examples, but I see that waveform only receives y not x values ( in the pic. GRAH A).
Instead I want to send values of x and y (couple of values) where the value of x varies, for example, from 0 to 50 and then from 50 to 0 and y varies accordingly value x, as shown in GRAPH B .
Have you some suggestion how to solve this problem?